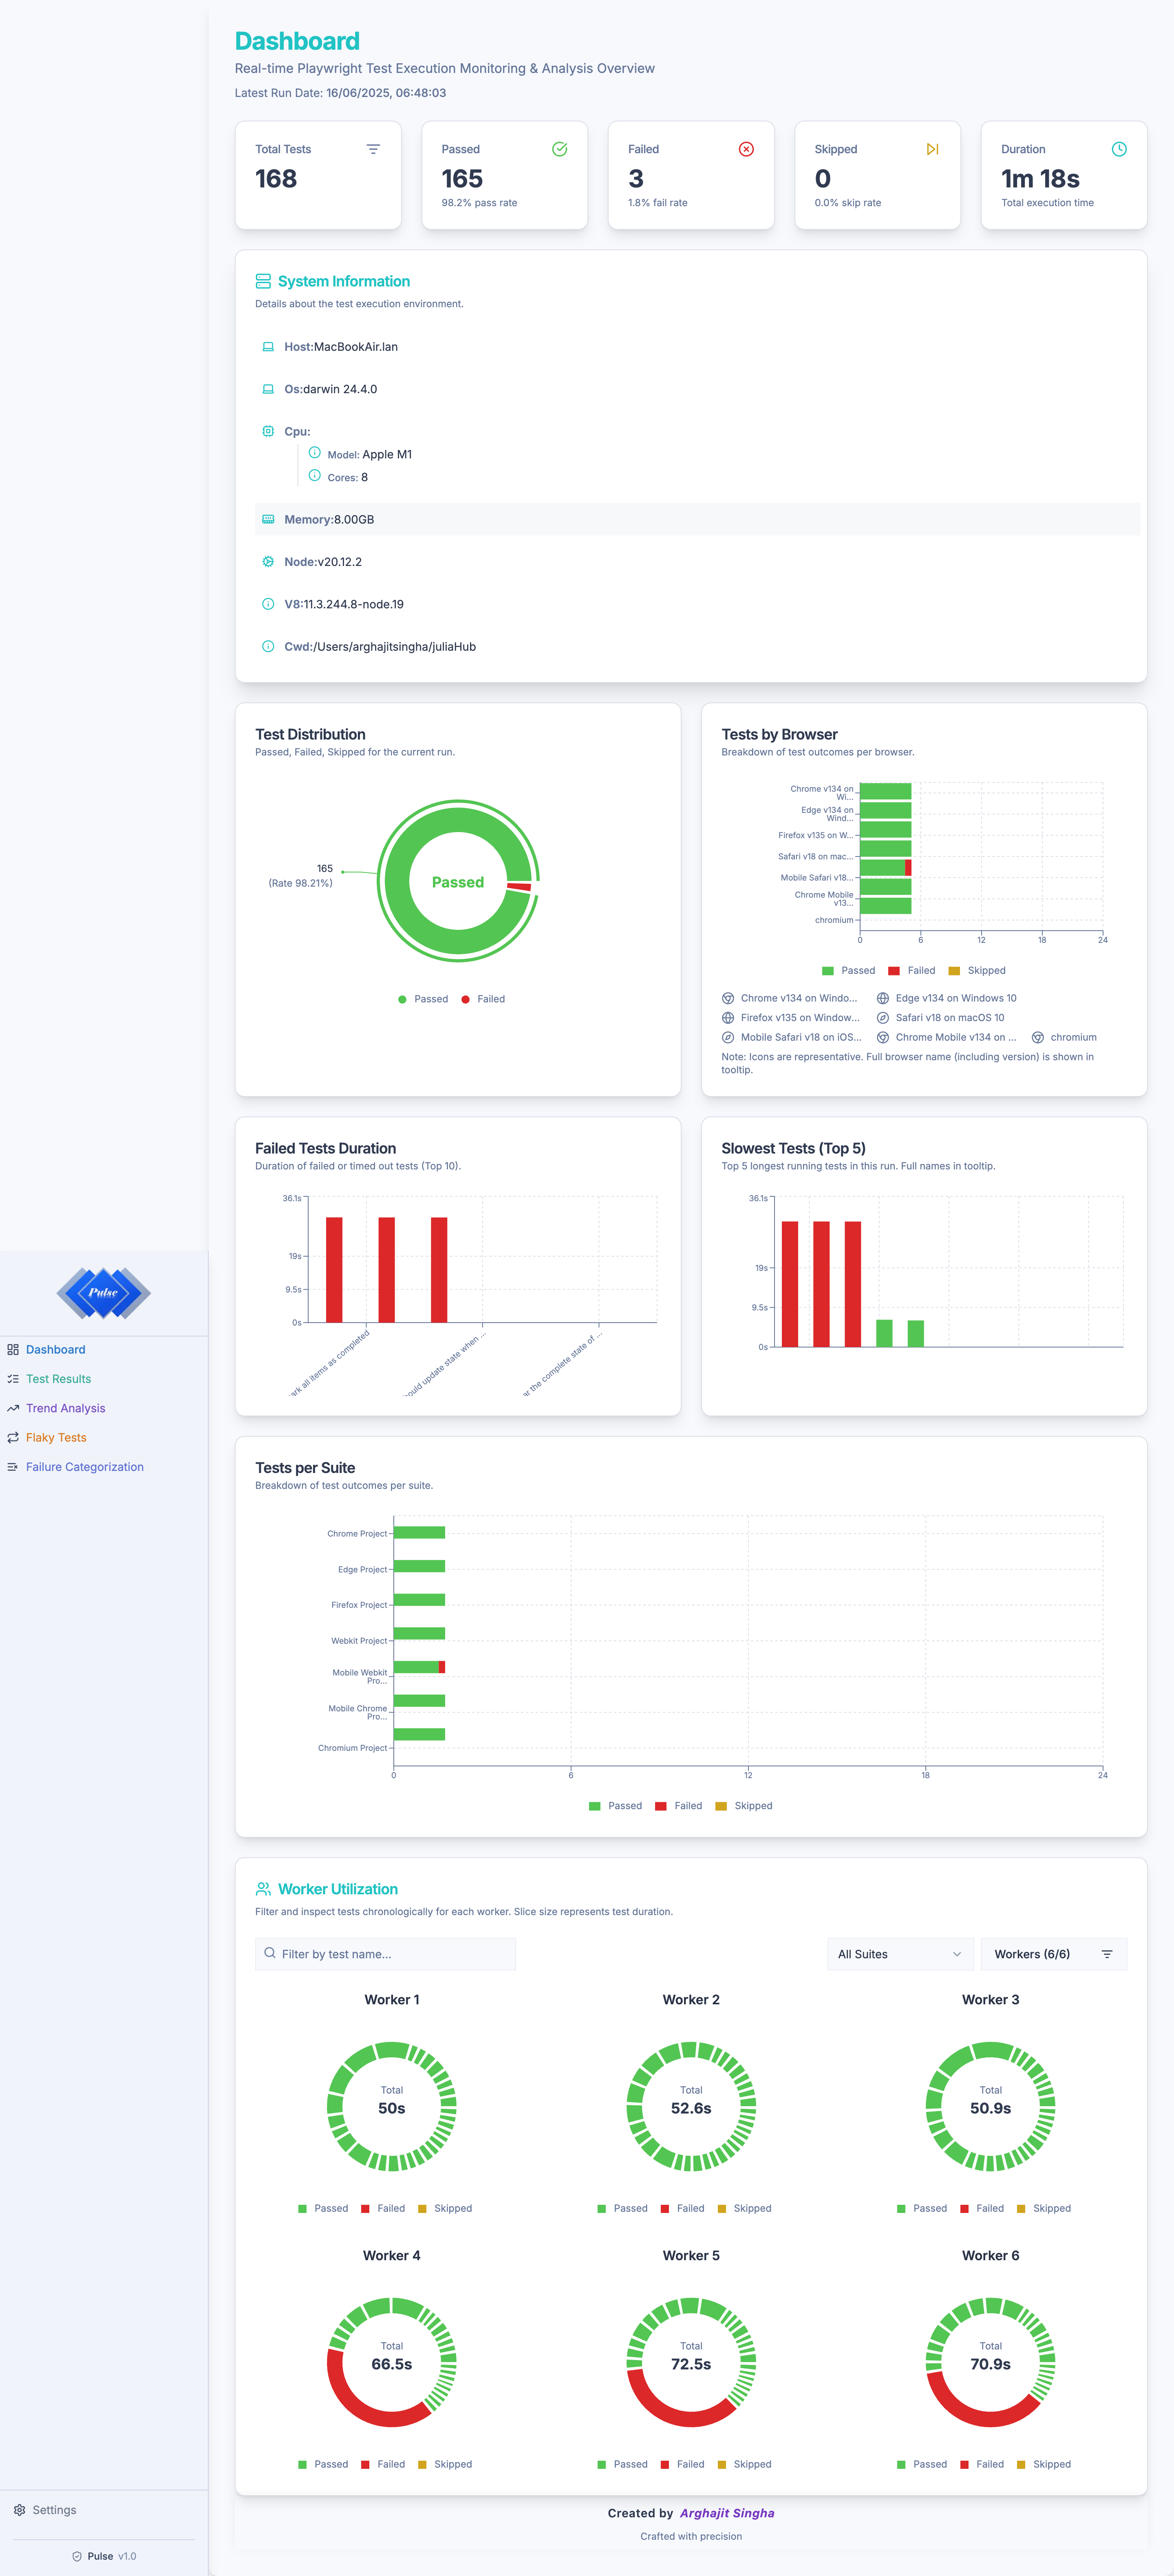
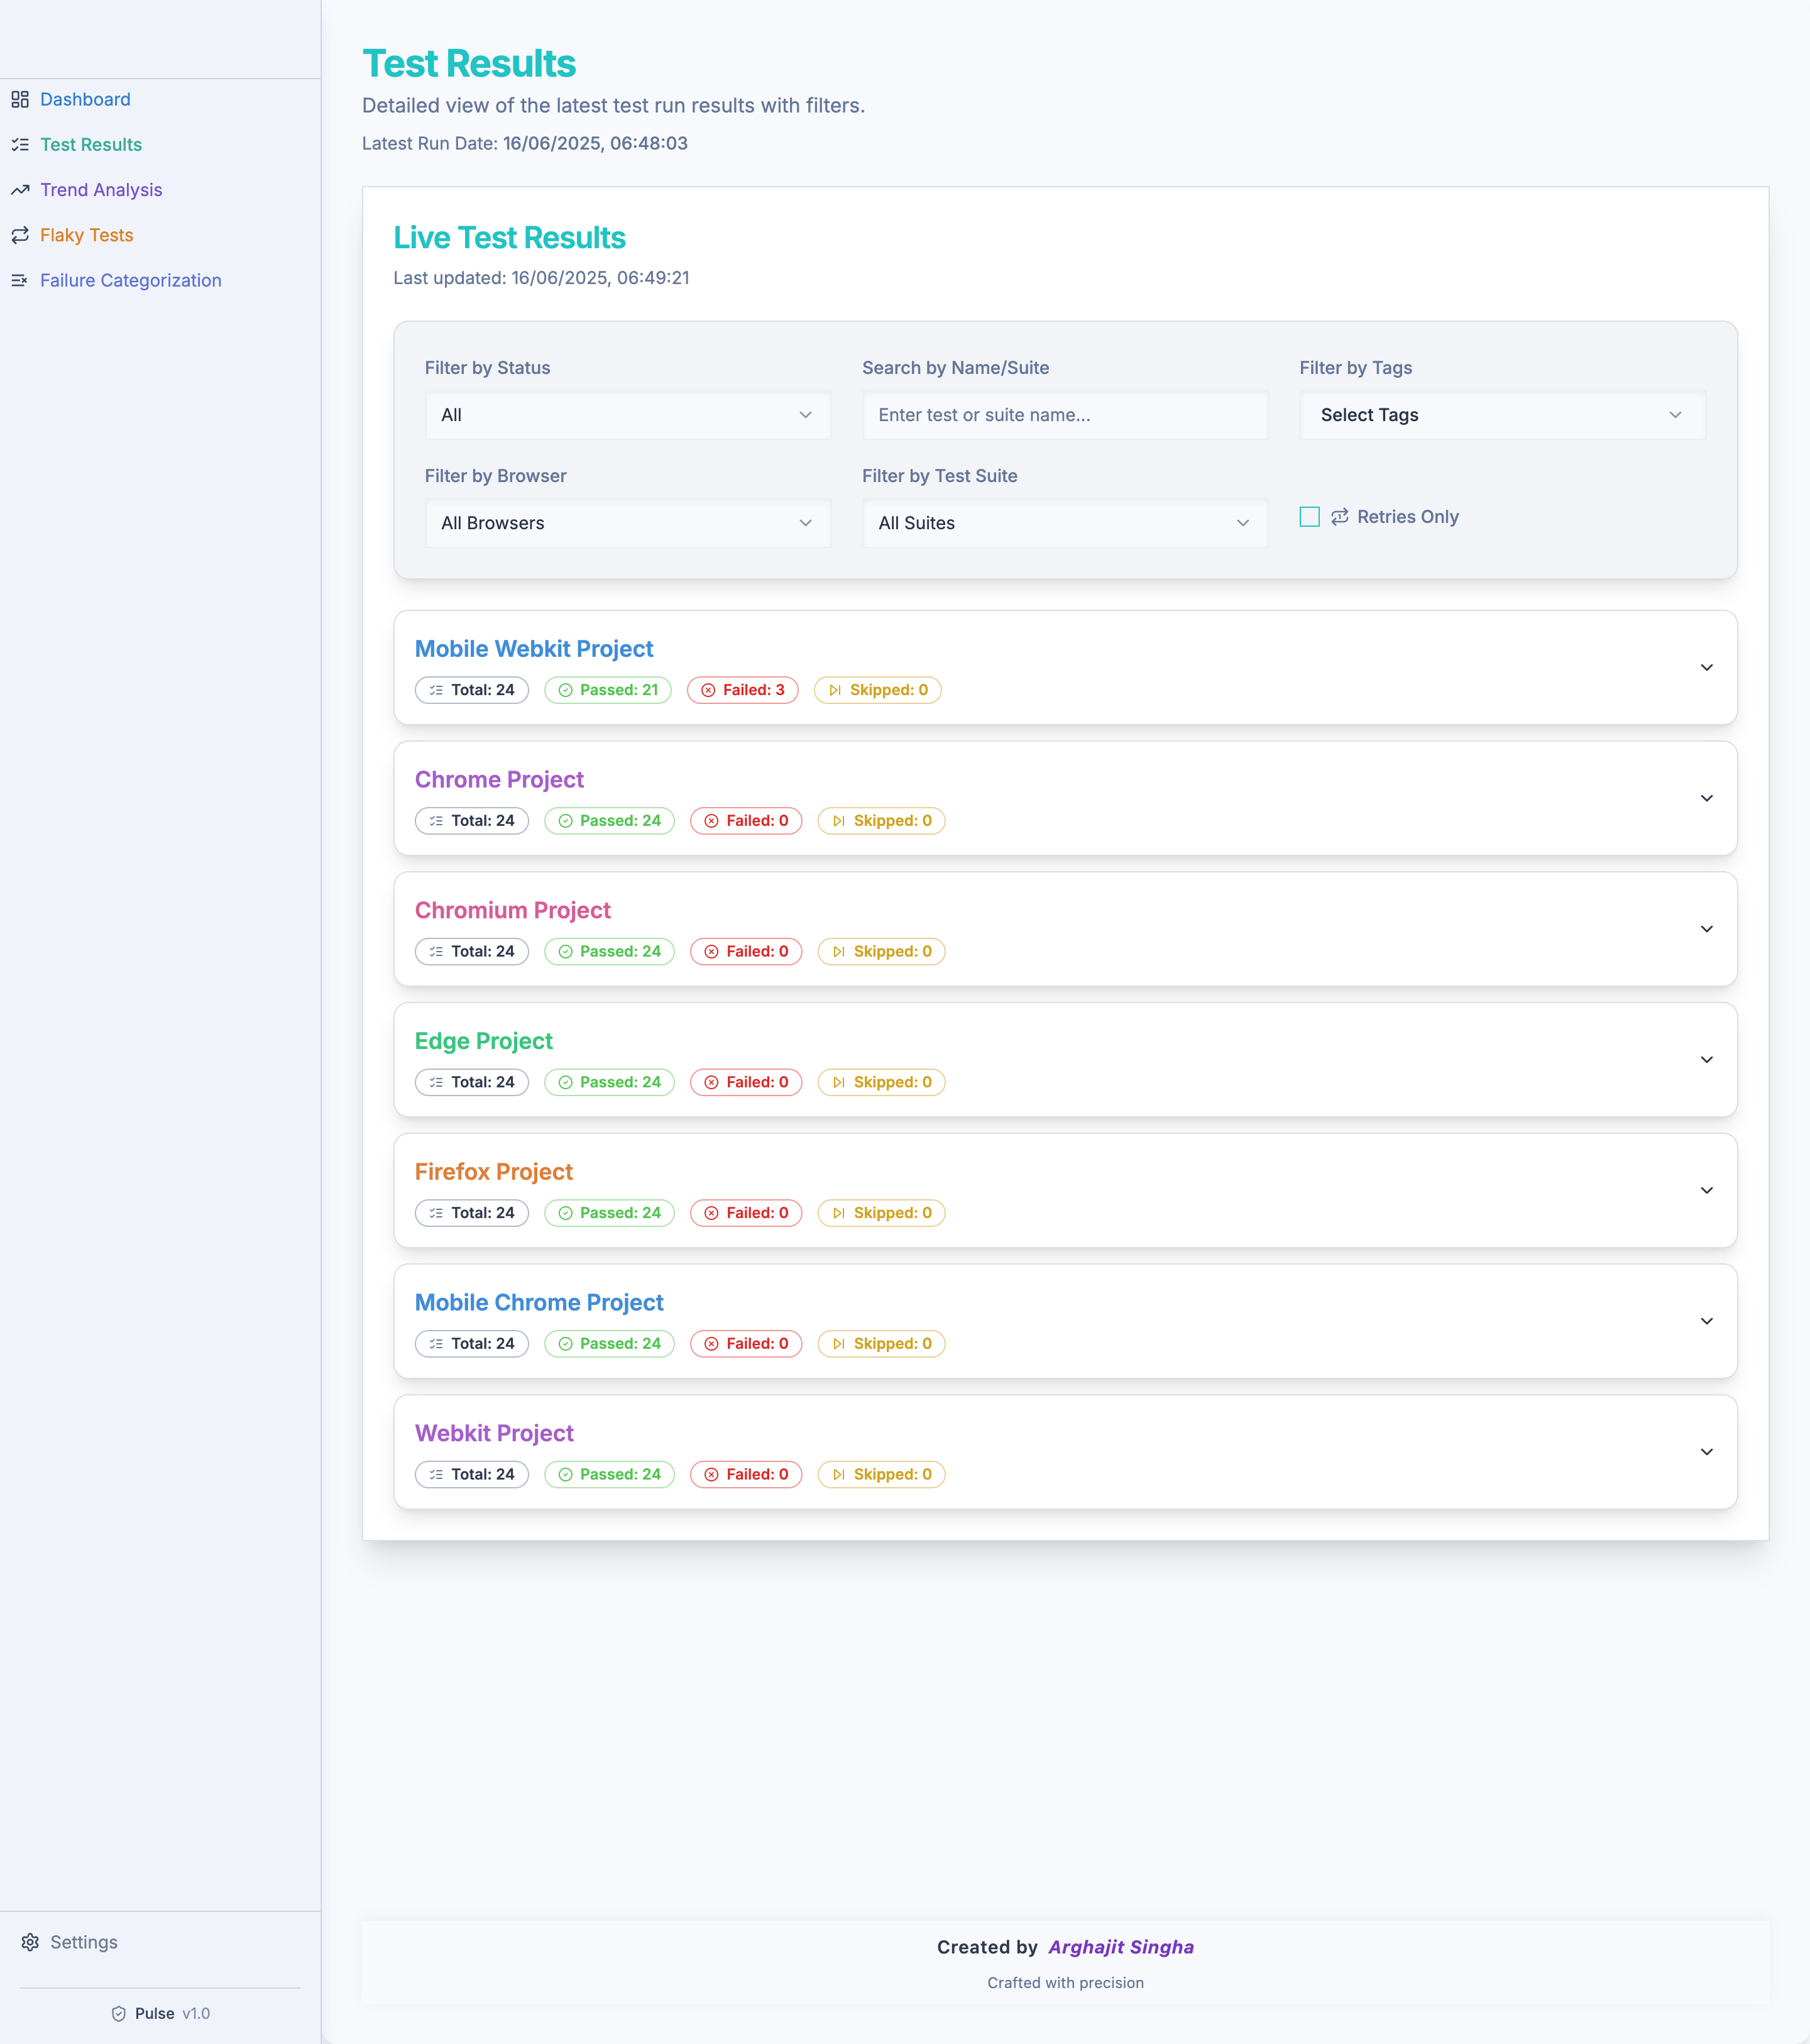
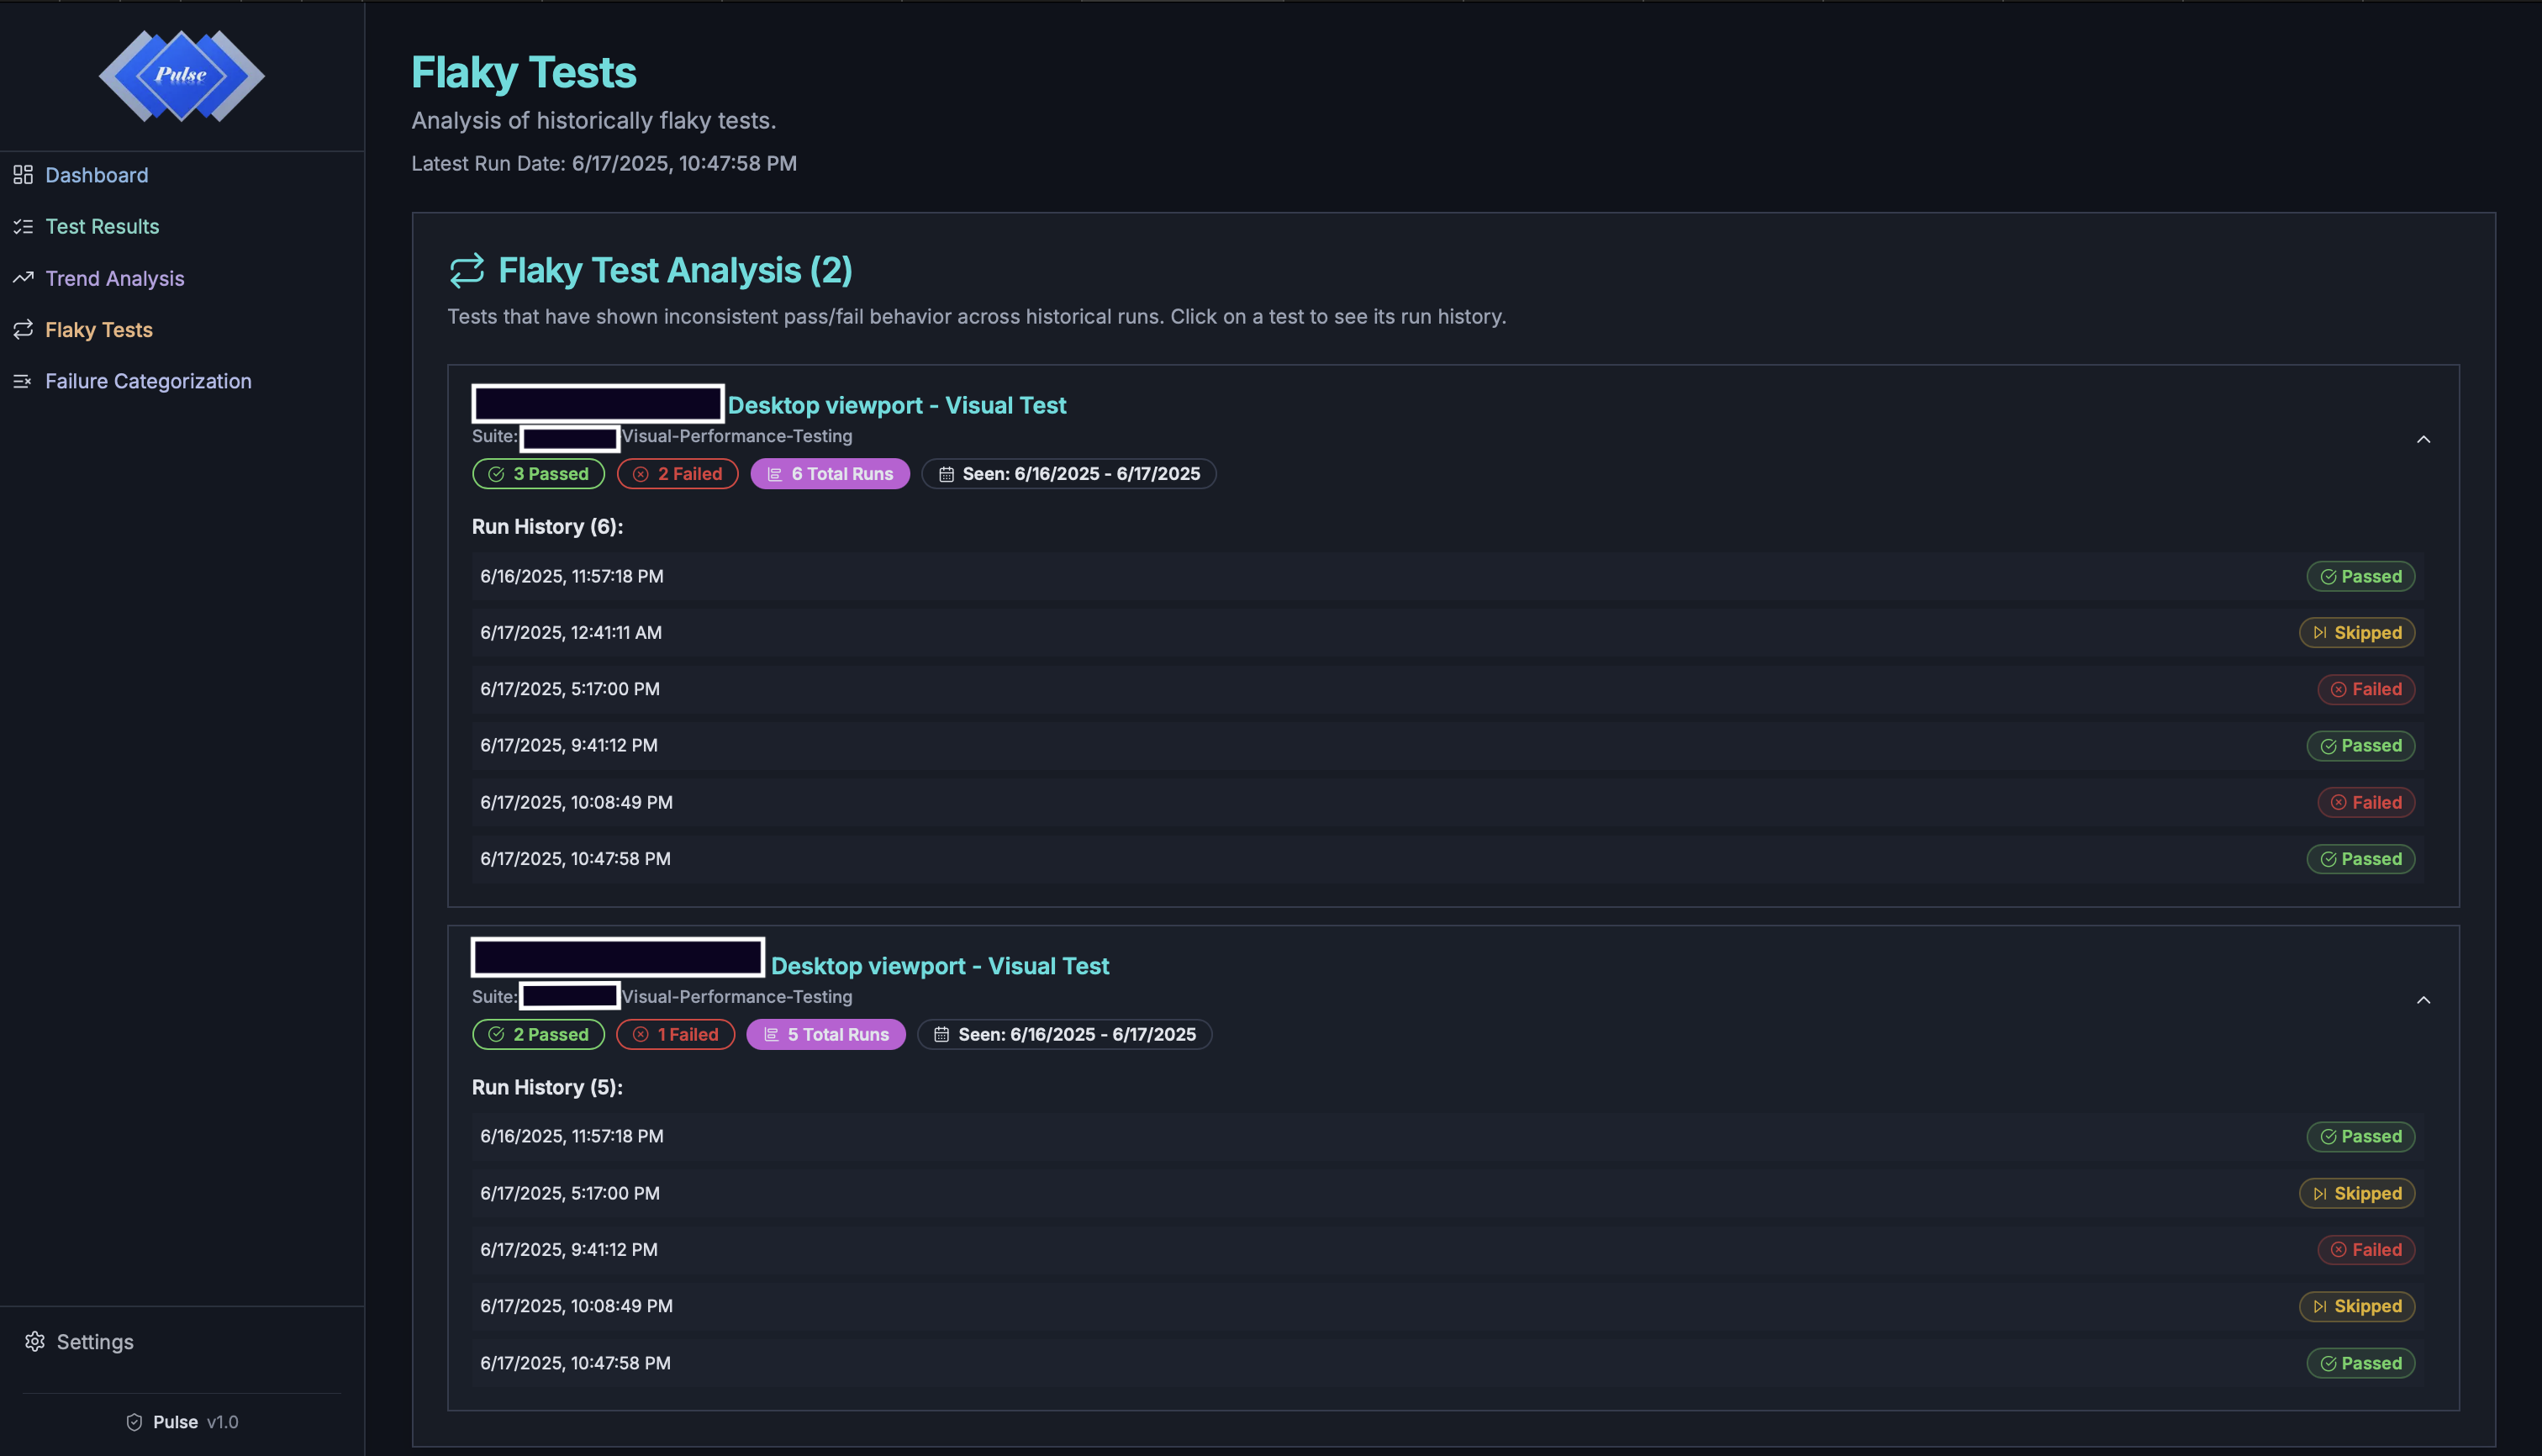
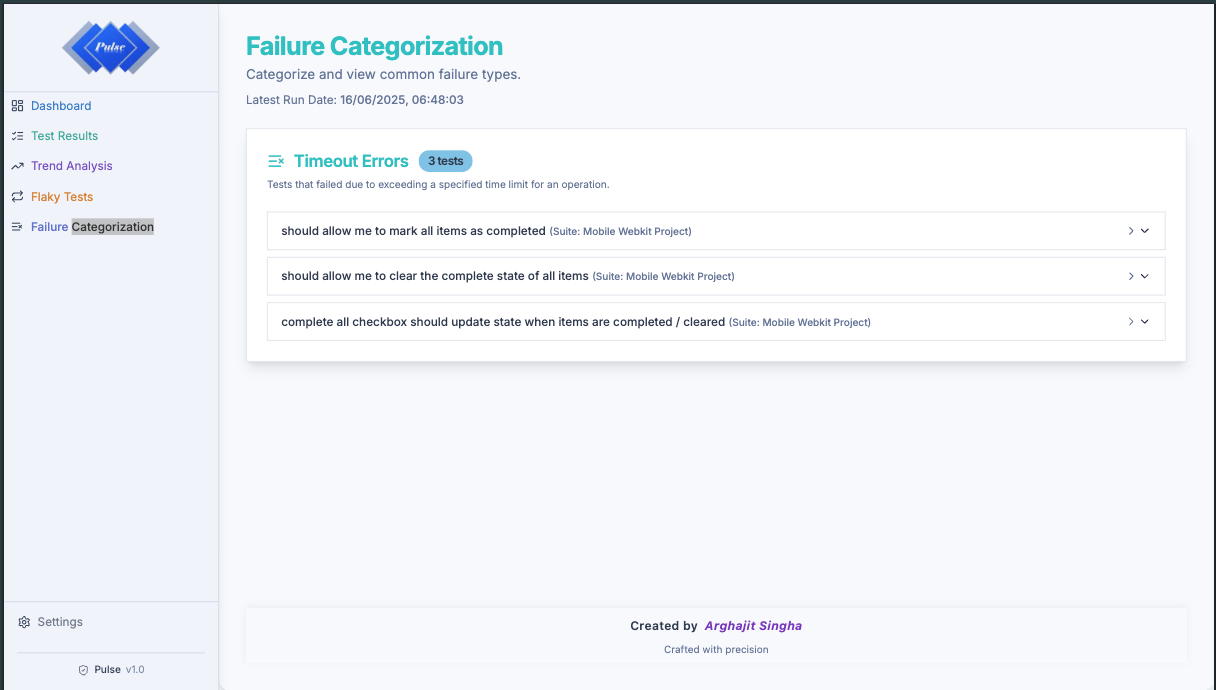
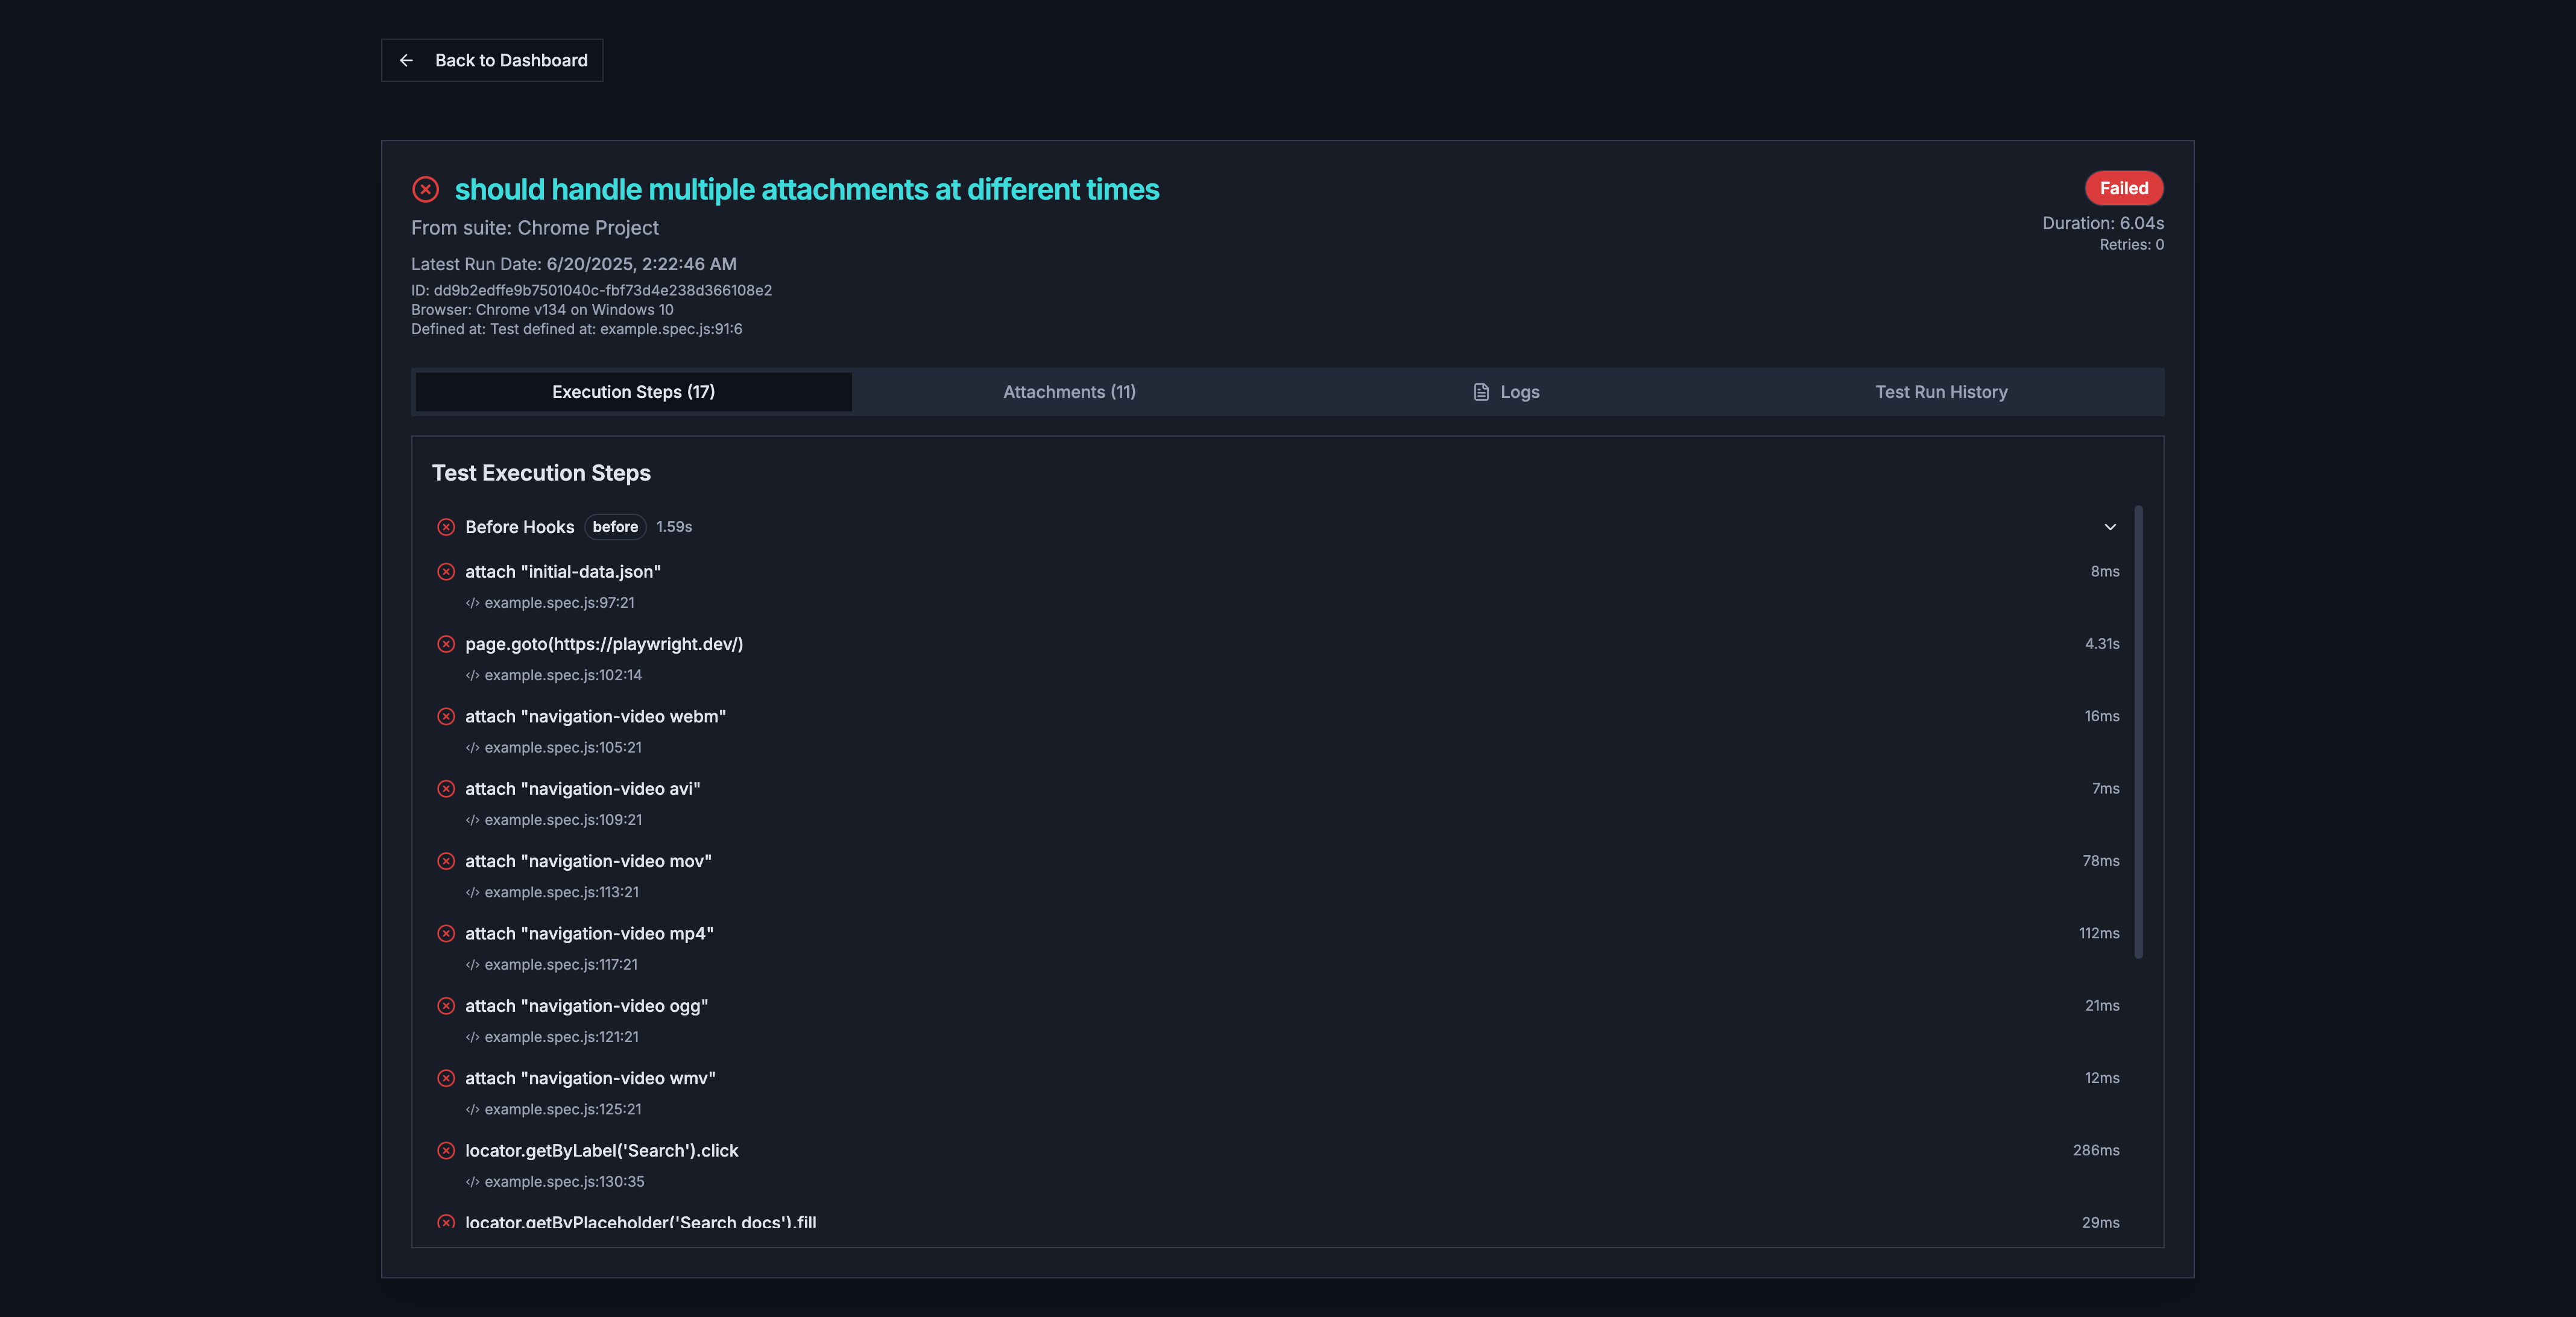
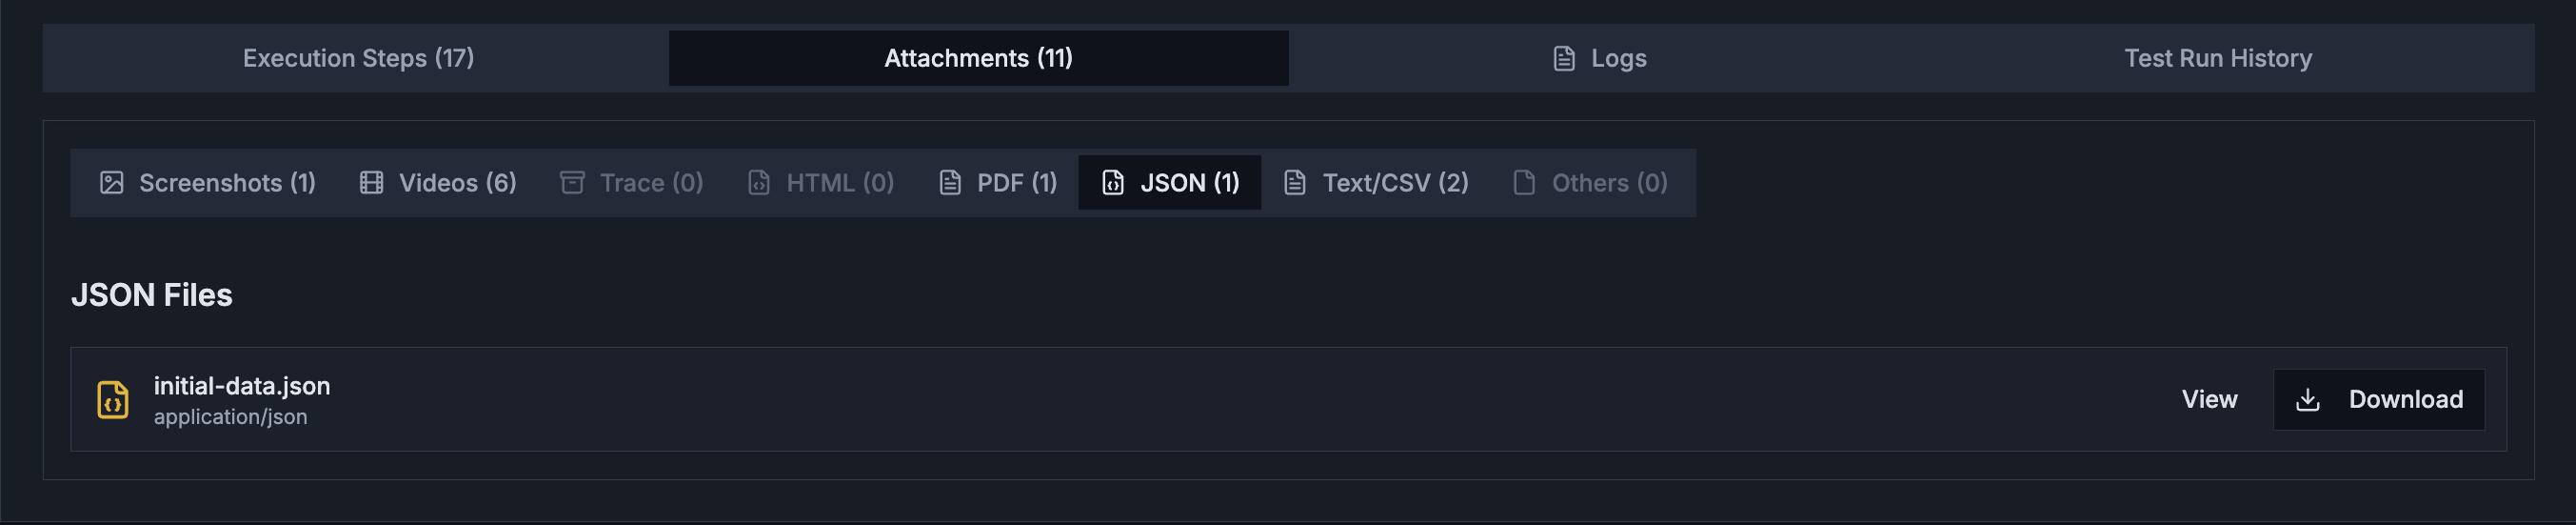
Pulse Dashboard is a reusable Next.js component and standalone CLI tool designed to provide real-time monitoring and historical analysis of Playwright test executions. It helps development and QA teams to quickly identify issues, track test performance over time, and gain insights into failure patterns.
It can be: Run as a Standalone CLI Tool: Install globally or use with npx
to quickly view reports.
[Note: Pulse Dashboard uses playwright-pulse-report generated data]
Getting started with Pulse is simple. You can install it as an npm package and run it with a single command.
Use npm package manager to add Pulse to your project.
npm install pulse-dashboard@latest
After installation, start the dashboard using the following npx command from your project's root directory.
npx start-dashboard
The dashboard provides a high-level, real-time overview of your latest test run. It is the central hub for at-a-glance information about your test suite's health.
👉🏼 The Test Results page allows user to browse and filter the outcomes of the latest test run. You can expand each suite to see the individual tests within it.
👉🏼 Expanded Test Results provides user a quick look for the failed test cases, including the proper formated test error log and with attached failure screenshot.
This page provides historical data visualization, allowing you to track test performance and stability over time.
👉🏼 Test Outcomes Over Time: This chart provides an detailed analysis of the test suite runs, for current & existing historical run trends, in chronological order.
👉🏼 Test Duration Over Time: This chart provides total duration of the test suite runs, for current & existing historical run trends, in chronological order.
Flaky tests are tests that exhibit inconsistent behavior. This page helps you identify and analyze them by showing their historical pass/fail rates.
This powerful feature automatically groups failed tests by the common type of error that occurred, helping you quickly identify the most common root causes of failures.
This page provides an in-depth, granular view of a single test execution. It is the primary tool for debugging a specific test failure. The page is organized into several expandable sections.
A step-by-step log of every action performed during the test. Failed steps and error messages are highlighted in red for easy identification.
Access to all artifacts captured during the test run, such as screenshots on failure, videos of the execution, and detailed Playwright trace files for debugging. Also provides a visual scope for test.info().attach()
files.
View any console output (from console.log
) and standard error streams that were generated by the test or the application during the run.
A historical view of this specific test's performance and status across previous runs. This helps identify if a failure is new, recurring, or intermittent (flaky).